Thin Markets (Trade Events)
Some commodities are naturally thin. This means that comparing the filesize of Crude Oil, which is a highly liquid market, and may have multi-millions of trading events within a day, will not be the same as comparing it to a highly illiquid commodity, such as the Korean Won, which may only have several trades per day, if that.
If you are purchasing 1 minute data, or trades-only tick data, then there will only be a row of data present IF there was a trade. If there were NO trades then there will be NOT be a row. This is a very common misconception. As an example, for 1 minute data, where there is a maximum of 1440 minutes in a day, only minutes that contained trades will be seen. Portara also includes the daily settle price within the 1 minute data to allow you to create continuous data based on settle if you so wish. Without the daily settle prices this would not be possible without purchasing the standard daily data sets from us too.
In cases where the market is highly illiquid, or in periods prior to the first trades of the contract ever taking place, and which can continue for many years, the settlement strikes may be present as a single row in the data. Settlement strikes can go on for some considerable time before the data becomes liquid enough to begin to display intraday rows.
Data at the Beginning of Contracts and Nearing the Expiry Date of Contracts
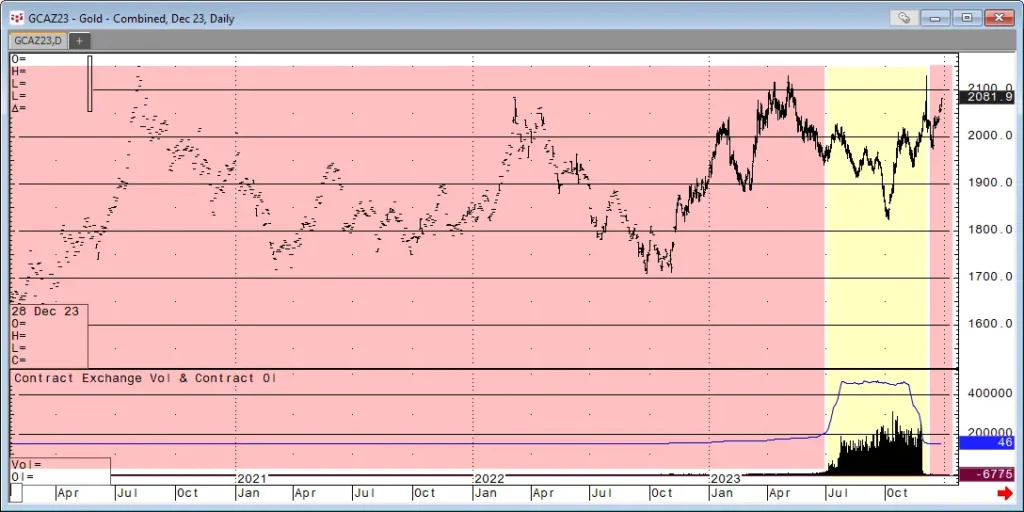
Naturally, futures contracts have an inception date and ultimately an expiry date. However, there is usually only a small segment of time during the life of the contract whereby there is a lot of liquidity, i.e. a robust collection of data rows in your files. For example, in the image below, and when liquidity is an important factor, the only relevant data for a trader is the data that falls within the yellow band.
In this case, 85% of the data in the file is ignored. Remember also that the data goes thin towards the expiry of contracts as traders jump to the next available liquid contract. In the case of Gold, and by convention, this is around 3 weeks prior to expiry. All commodities differ with their own unique set of rules determining when liquidity falls. As an example, with global indices there is still plenty of liquidity up to 1-2 days before expiry.
Illiquid Contracts Within a Commodity
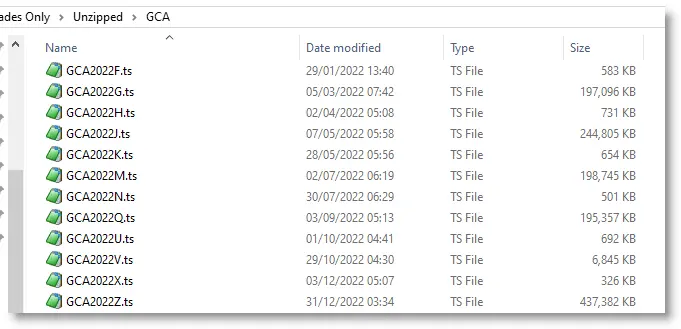
Another common misconception is the notion that all contracts within a commodity should display a similar filesize. Although this is true in many cases, in many other cases, it is not. For instance, sticking with our example of Gold, by convention, only certain contract of Gold are traded and some are ignored. In the image below of a snapshot of tick data trades-only filesizes for Gold it can be seen that the only active contracts tend to be GJMQV and Z. V also by convention tends to be skipped by traders too. You can clearly see a dwarfed-size to it, compared to the other active months.
Historical Data Around Inception Dates | Beginning of Historical Continuous Data
Another misconception is just because a commodity is highly liquid today does not mean it was highly liquid in the past. A purchase of data in a commodity may result in many years where data was thin in prior years followed by fruition, or a blossoming as traders began to trade it actively. There may also be periods when the earliest delivery months in a commodity were empty, or even absent or look entirely different from today based on traders nuances or exchange decisions in the past or around inception dates.
Naturally, there is more liquidity now than in the past. A continuous series of data over say 40 years may display little or no liquidity 40 years ago only to be trading with millions of events per day now. When analyzing continuous data, you need to take this into account. Data for a commodity in the past will be a lot smaller than that very same commodity now.
Negative Series Data
Sometimes when constructing a backadjusted series, data can become, and appear with negative values. A common misconception is that somehow the data is incorrect. Data with a negative series or part thereof is perfectly valid. Remember it is the SHAPE of the data remaining the same which is key, not whether the values appear negative or not. It is a result of the cumulative backward dated adjustments (the spreads between close-to-close rolls added together) being of a higher value than the current data price at that particular point in time.