Graphical Analysis
Summary & Detailed
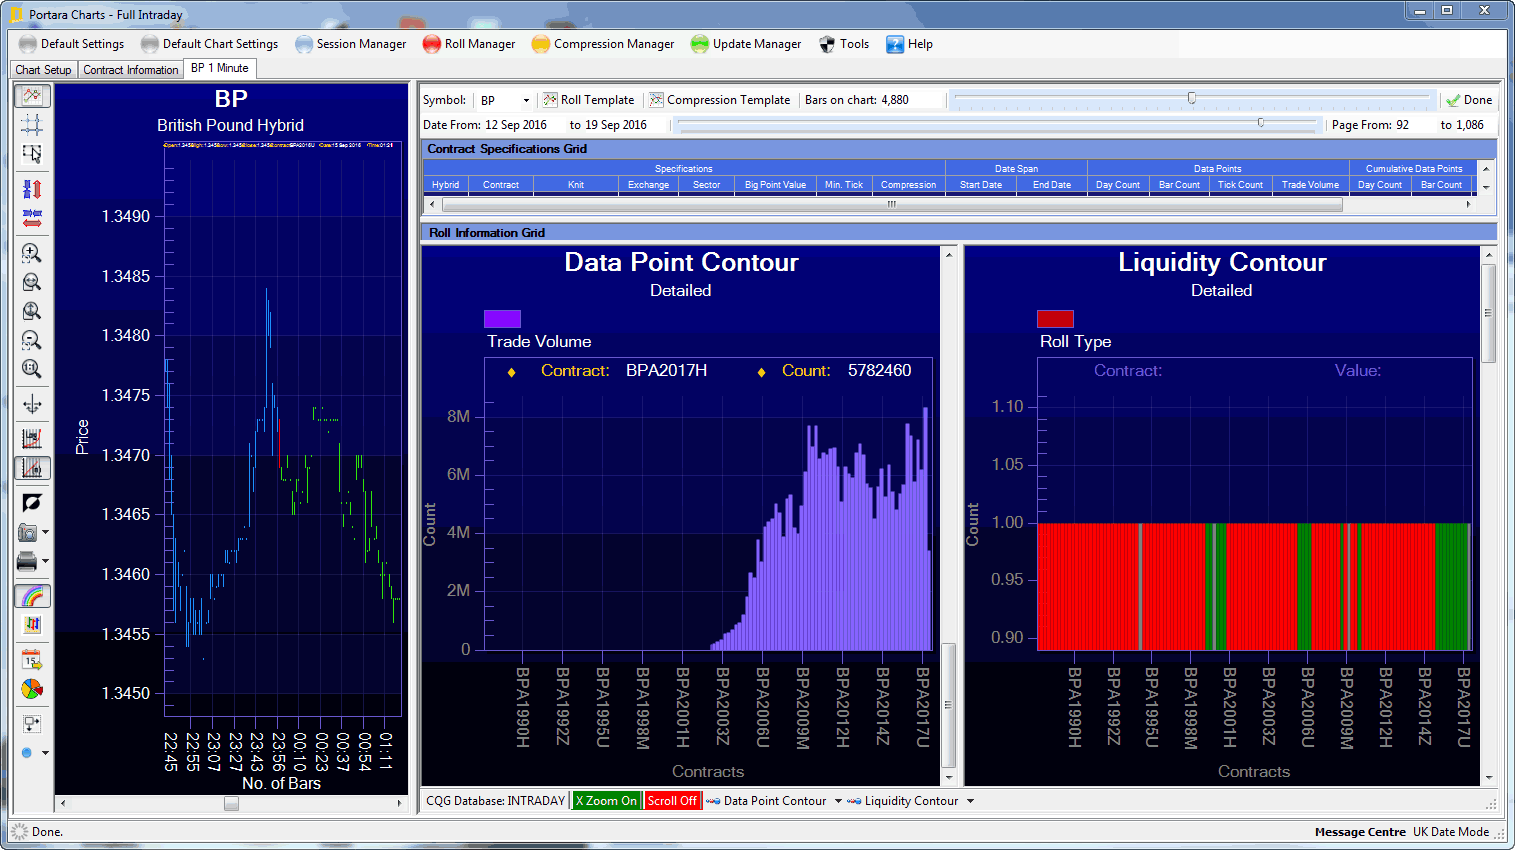
The Data Analysis Section provides the user with the attributes that determined the roll logic ascribed to the hybrid. There are two grids providing information. The Contract Specifications grid shows the data used in the rolls for every underlying actual contract from the database plus the specifications. The Roll Information grid shows all the roll information associated with that part of the viewable contract shown in the data viewer to the left. Each grid is split between the pit and electronic for complete clarity.
Data Point Contours and Liquidity Contours are shown as pie charts beneath the grids; they are fully adjustable and flexible. Double-clicking the pie charts allows a closer inspection of the data at better resolutions. They are split into summary and detailed visualisations to aid the researcher.
Backwardated and Contangoed Contracts
Easily distinguish graphically the backwardated contracts (in red) and the contangoed contracts (in green). You may now simplify the process of searching for trading opportunities around this type of edge, but importantly you can see graphically the nature of the historical stream in relationship to these events.