Blog


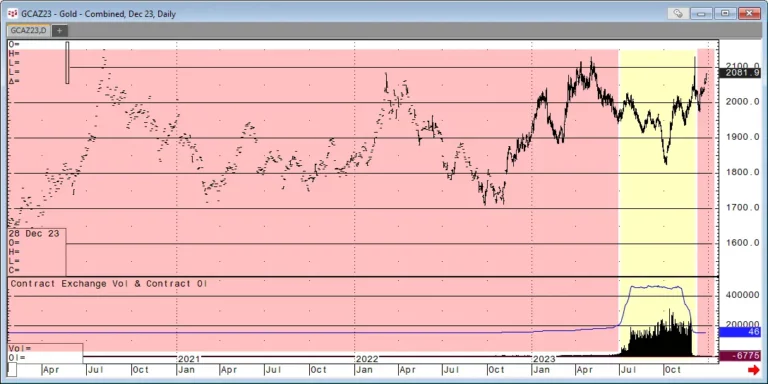
Gold Futures Chart -December 2023

Common Data Misconceptions

Some commodities are naturally thin.  This means that comparing the filesize of Crude Oil, which is a highly liquid market, and may have multi-millions of trading events within a day, will not be the same as comparing it to a highly illiquid commodity, such as the Korean Won, which may only have several trades per day, if that.

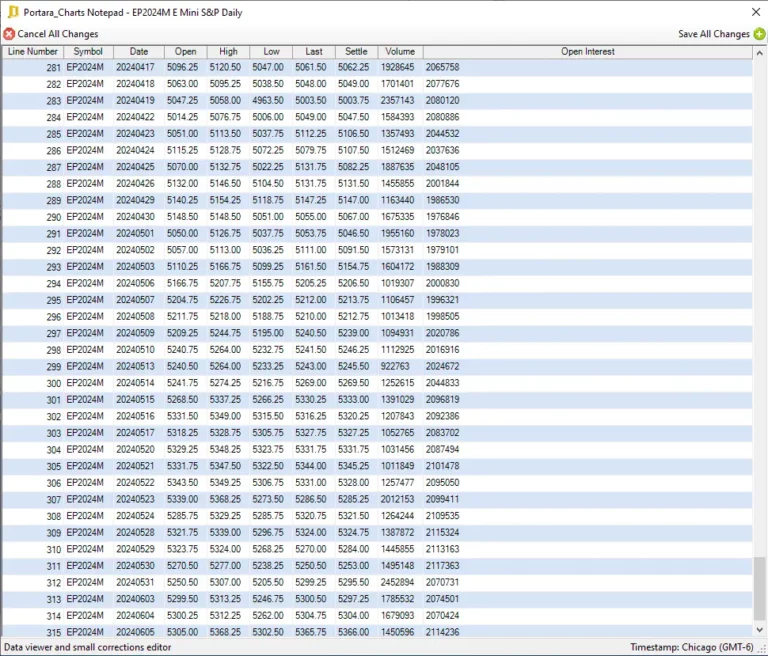
ES Settlement Data

What is daily data & Why is it important?

Daily data is a vital aspect of the financial and commodities markets, providing traders, investors, and analysts with crucial information about the trading activities of futures contracts on a day-to-day basis. This data encompasses various metrics and insights that help market participants make informed decisions, manage risks, and strategize effectively.

Silver Bar

Exploring Historical Silver Futures Data

In the dynamic world of commodities trading, silver futures (symbol SIA) stand out as a fascinating avenue for investors seeking opportunities to diversify their portfolios and hedge against market volatility. However, making informed decisions in this realm requires access to robust historical data that can provide insights into price trends, patterns, and potential future movements. In this blog post, we delve into the significance of historical silver futures data and how it can empower traders and analysts to navigate the intricate landscape of the silver market.

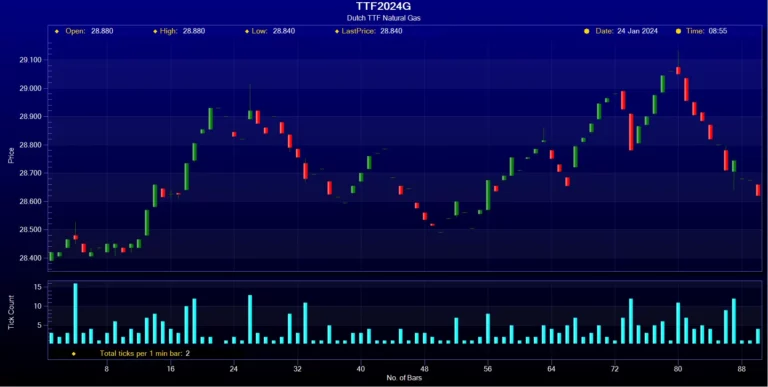
TTF Futures Data Jan 24th 2024

Dutch TTF Natural Gas – How Does It Work?

Welcome to the Dutch TTF Natural Gas market (futures symbol TTF), where we’ll explore how this innovative system works and what it means for energy consumers. The Dutch TTF (Title Transfer Facility) has become one of the most influential and sought-after trading platforms in the global natural gas market.

Stocks vs Futures: What’s The Difference?

In the world of investments, stocks and futures are two popular choices for traders seeking to grow their wealth. But what sets these financial instruments apart? Understanding the difference between stocks and futures is key to making informed investment decisions.

Exchange Traded Fund (ETF)

All About ETF Data

Looking to learn more about ETF’s and what they are? This article will cover everything from what ETF data is and whether ETF’s pay dividends all the way to how to download ETF Data and how risky trading ETF’s can be.

What is Intraday Data & Why is it Important?

Delve into the world of finance and stock trading, and you’ll eventually encounter the term “intraday data.” So, what exactly is intraday data and why is it indispensable for traders and investors alike? For active traders, intraday data is the lifeblood of their strategy, enabling them to identify potential entry and exit points. Whether you’re a day trader, swing trader, or a long-term investor, understanding and leveraging intraday data can significantly enhance your trading prowess and profitability.

FTSE 100 Futures Chart

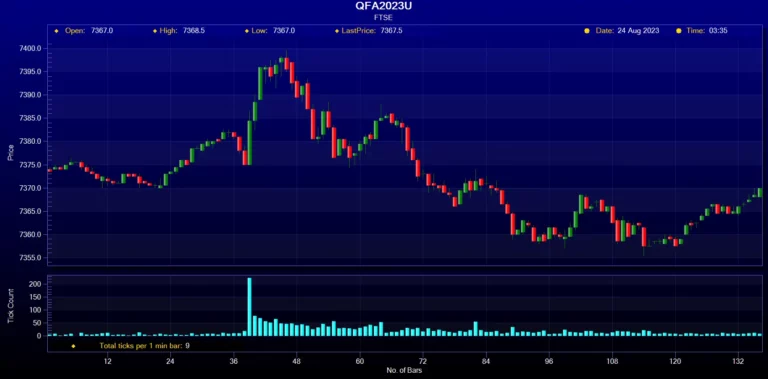
A Beginners Guide To Historical FTSE 100 Futures

Throughout history, the FTSE 100 index has been a reliable barometer for the UK stock market. By analyzing past trends and patterns, you can gain a deeper understanding of how the market behaves and make more informed investment decisions. In this beginner’s guide, we’ll walk you through the basics of FTSE 100 futures, from what they are to how they work.

Gold Futures

Gold Futures: A Brief History & Beginner’s Guide

Are you intrigued by the world of commodities trading? Curious about how gold futures work and what they can offer to investors? Look no further! In this beginner’s guide, we will delve into the fascinating history of gold futures and explore why this particular investment option has captured the attention of traders worldwide. From its origins in ancient civilizations to its modern-day significance as a safe-haven asset, gold has always held a special allure. We will unlock the secrets behind the value and versatility of gold futures, and explain how they can be used to hedge against inflation, diversify portfolios, and potentially generate substantial profits.

S&P CNX Nifty Index Chart

What is the S&P Nifty Index and How Does it Work?

The S&P Nifty Index (symbol ZIN) is a widely followed benchmark index in the Indian stock market. It tracks the performance of the top 50 companies listed on the National Stock Exchange of India (NSE). This index provides investors with a snapshot of the overall market performance and is often used as a gauge for the Indian economy. Understanding how the S&P Nifty Index works can be helpful for investors looking to make informed decisions in the Indian stock market.