In our latest article – How To Create Continuous Futures Data – We cover what continuous futures data is, how to create continuous data and why continuous data is important. We also cover some of the potential issues you may encounter when creating continuous 1 min data. Below is a short summary from the article:
To be successful at trading futures it is imperative that you fully understand how to create continuous futures data properly. You need to consider what significant mechanisms are at play and how to use and integrate them. But even more importantly, what pitfalls lie in store for you if you get it wrong and why.
If you are new to trading and are considering a purchase of continuous daily futures data or continuous intraday futures data then this is the place to start. If you are a veteran trader CTA or fund, then at least you will appreciate many of the concepts below. I have outlined some basic concepts first and then continued with more advanced discussions.
How to Roll Futures Data
If you read several of the blogs on the internet about how to create continuous futures data or how to roll futures data then yes it’s usually informative and yes, most of what they say does add up. However, it is usually written by an academic or person who is not actively engaged in seeking out profits through the physical act of trading. They miss out the key discussion areas ‘which are relevant to traders‘ when trying to determine how to roll futures data successfully. A lot of what they say can be interesting but not usually trader-prescriptive.
“The basic mechanism of how to roll futures data is to get a collection of individual futures contracts and join them together at specific key dates throughout history.”
Arthur Maddock – CEO
Below, you will learn why you can’t just choose a one-fits-all method to roll data. All commodities have their own roll nuances, and by what sometimes can appear to be whimsical convention, each have their optimal sweetspot.
Why Do We Need To Create Continuous Futures Data?
We need to create continuous futures data because if we compare any two futures contracts, then at any shared date (or timestamp) TWO prices exist1 — one price in the expiring contract and the other price in the new contract. If you look at the prices for both dates and match the timestamp, the two prices are NOT the same, they differ. If they are the same it’s pure coincidence. Futures contracts are mutually exclusive and are fully independent from one another.
Thinking further, the fact that you may need to exit your current position from an expiring contract and enter a new position in the next available contract as liquidity falls towards the old contract’s expiration date means that any historical data created that spans across the two contracts will require thought and consideration as to what it should take account of.
For example, the commodity Coffee trades in the months of March (H), May (K), July, (N), September (U) and December (Z)2. CQG’s data reach is extensive and for Coffee there are 253 individual contracts from 1973 to now that need to be spliced together into a single file to represent the continuous futures data. Once ready, the continuous futures data file can be imported into a backtester or trading platform in order to conduct research, or to trade off.
Types of Futures Data Adjustments
There are several ways in which individual futures contracts can be spliced together. Each roll type is useful in some areas but not in others. The way you trade has an important impact on what type of continuous futures data mechanism you opt for. The most common adjustments are:
What is Backadjusted Futures Data?
If you are a medium or long term trend follower then you are probably going to require continuous futures data that has been backadjusted.
Backadjusted futures data is by far the most popular adjustment mechanism for medium to long term trading strategies. If you hold positions for several days in the markets rather than get flat at the end of each day this is normally the best choice. The objective of the method, in fact any continuous data method (apart from zero adjust) is to:
- Remove the ‘gaps’ that form at the roll spot.
- Join all the individual data files together into one file containing all the data3
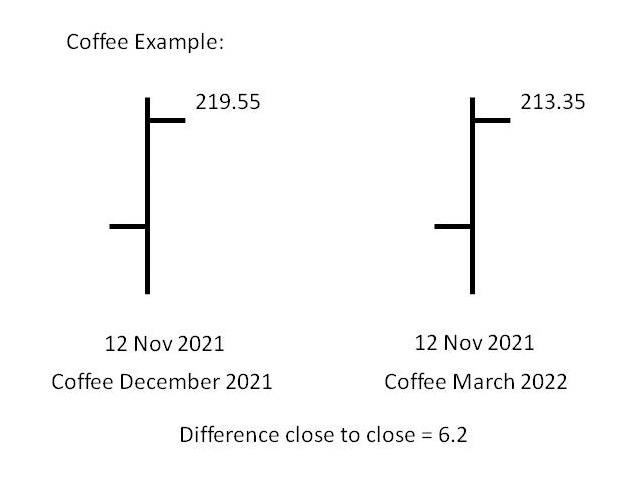
So, in the example, we need to adjust the BACK month, i.e. make the 12 November close in December 2021 Coffee 213.55 too. We do this by removing 6.20 from the open, high, low and close for that specific bar. This is where the word backadjusted derives from.
considerations:
- We have adjusted the one bar at the roll date. However, we now need to adjust ALL the data in the December 2021 contract by 6.20 too. That should make sense, right?
- Next we need to consider that we have 253 individual files in which we need to apply the same process. So, if we move backwards to the next contract, in this case it would have been September Coffee moving into the December Coffee, the adjustment close to close might turn out to be 4.80. So now it’s a matter of adjusting the data in the September Coffee by a factor of 11.00 (6.20 + 4.80). The point to remember here is that the adjustment method is CUMULATIVE. So, with each progression backwards you need to adjust by the cumulative amount each time. In this case it is 11.00 made up od two numbers, backwards further will consist of 3 numbers etc.
What are the benefits of backadjusted data?
To answer the question of what is the point of backadjusted data you need to return to your trading methodology. For long term trend followers the continuous futures data now adopts an intuitive ‘shape’. This means that entering a position on September 2021 Coffee and exiting a position in March 2022 Coffee when looking at backtest results, does not skew the profits or losses of that position as it has accounted for the ‘gaps’ between different and mutually exclusive futures contracts.
What are the drawbacks of backadjusted data?
No continuous roll method comes without drawbacks. Here are a few:
- The only contract that aligns with the individual contract history is the final contract in the series. All other contracts have been backadjusted by the cumulative value.
- For this reason you may need to view the individual contracts too.
- Any indicators that you apply to the data may need consideration. If for instance, you have a 200 day moving average and apply that to the backadjusted data then that may look and behave very different in real time when comparing it to your individual contract’s 200 day moving average when placing trades. The issue is that an individual contract may only have 90 days of data in it. If you require 200 days of data to form the moving average you may only be capable of doing that in the continuous data series. This is why the moving average may differ enormously when contrasting data shape.
- If the adjustment each cumulative increment backwards always leads to prices falling at some point the data may go negative. Although valid, backadjusted data may not be compatible with current backtesting software. You need a data supplier who understands these issues and can offer alternatives to suit your setup.
Can I Backadjust Data in an Excel Spreadsheet?
This question gets asked a lot. The answer I tend to give is that it depends. If you are a wiz with Excel, especially areas of datetime, and you are looking at daily data the yes, it may be worth a go. However, you do need to understand the gotchas associated with this method, they are very real so to be extremely careful is key!!
If you are looking at anything above daily data then the answer is a big NO. It’s a waste of time and effort to consider intraday data with the method. Excel wasn’t designed to deal with big data issues. You will require programming knowledge to make that happen or an expert that provides continuous futures data who can do the job for you.
Another word of caution too… never buy data, any data for that matter, but especially ‘ready-made’ continuous data from the online bucketshop suppliers. The bucket-shop route is a guaranteed ticket to the poor house.
What is Forward Adjusted Data?
I have been around the data world for a long time. I have only ever created forward adjusted data for one client. It is obscure and not used much. The premise is that it is the opposite way around to backadjusted data. It is the most historic contract that remains identical to the individual contract. The cumulative adjustments are traversed forwards through the data contracts from most historic to current. Does forward adjusted continuous data provide any benefits? I am uncertain. I can’t think of any off the top of my head, but maybe you can? Let me know…
What is Ratio Adjusted Futures Data?
who This is the adjustment method that requires the most caution. Ratio adjusted data is often used when looking at VAR (Value At Risk) across a portfolio and position sizing. It is specialized and in the wrong hands can be disastrous. If you know what you are doing then fine. However, if you are new to trading in any way and are in the curious mode for what this represents, don’t just dive in without making sure you understand the mathematics behind it.
I did a blog post on ratio adjusted methods with a quant group called Cabestan Research, who are based in London, several years ago and created a white paper on ratio adjusted methods. It is technical but the fundamentals of the method are outlined. The main difference between forward and back adjust algorithms compared to ratio adjust algorithms is the fact that the former are additive and the latter are multiplicative.
What is Zero Adjusted Futures Data?
This is perhaps the easiest concept to understand. Zero adjusted data is either 1 minute futures data or daily futures data which has been joined together to form a continuous series. However, with this method there is no adjustment that gets applied. The gaps are left ‘as-is’. This way, you get the benefit of continuous futures data showing the actual prices of what occurred in the market and the data all in one file. This method is good for traders who still want the advantage of having long lookback periods in their data stretching across multiple contracts. This way they are only interested in the most liquid parts of all conjoined contracts but where they do not hold positions for long periods of time or across roll dates. Traders using this style of data would tend to be more short-term. Day traders often use this methodology.

Continuous Intraday Futures Data Problems and Solutions
When we create continuous daily data the moving parts are much less than when we wish to create continuous intraday data. Once timestamps, rather than just dates are included, things become more complex. Also, the close is not just the settlement anymore, it can now be interpreted according to the trader’s needs. This needs more explanation.
CQG data is known by everyone worth their mettle as being the best provider of intraday data globally. This is the reason Portara and CQG service so many funds with their data. Have you ever wondered why that is the case?
Problem 1 | Solution 1– Robust Data Sets
One of the reasons why, is that CQG has a huge data integrity department that makes sure the data is clean. They look and correct this stuff 24/5. There are hundreds of staff in 12 countries at the time of writing. What that means is the data is ROBUST. It is no good purchasing data that purports to offer data cleaning. How do you know what they are doing is even correct? There is a whole ethos surrounding do’s and don’ts of data collection and cleaning that is decades old. Robust historical data sets are the most important resource that a trader can invest in. Otherwise it ends up being a classic case of ‘Garbage In Garbage Out’ (GIGO).
Problem 2 | Solution 2 – Requirement for settlement price in intraday and tick data
CQG data sets provide the settlement price timestamped into the intraday data as standard. Why do we do that? Because if you don’t do that how are you going to form a roll that follows the daily data set? If you try to use the intraday data price points to form a roll you are faced with the following issues:
- Continuous intraday data will be completely different to the continuous daily data it should try to emulate. The data shapes will not match. You now have a data set of apples trying to be a data set of oranges.
- If you do purchase continuous intraday data from data suppliers who do not include the settlement then all you will achieve is data sets based upon non-settlement roll methods!
- Further, if you create continuous intraday futures data based on any type of non-settlement roll methods and contrast the differences to the daily data set, any backtest that does contain both data sets will be skewed and out of alignment.
Problem 3 | Solution 3 – Fixed Roll Methods ‘No thank you!’
It is no good purchasing continuous intraday futures data from a supplier offering ‘fixed’ roll methods. As how do you know what they are and why they are there? You wouldn’t give investment money to someone with a black box where you didn’t know the rules, or at least understand what’s inside it. So what’s the difference here? If you are purchasing continuous data to make investment decisions you need to have a data audit trail of where the rolls took place and why. Going forward because continuous data is always changing at the next roll, if you have data updates then you need to be assured that the data is the same or follows the same set of rules.
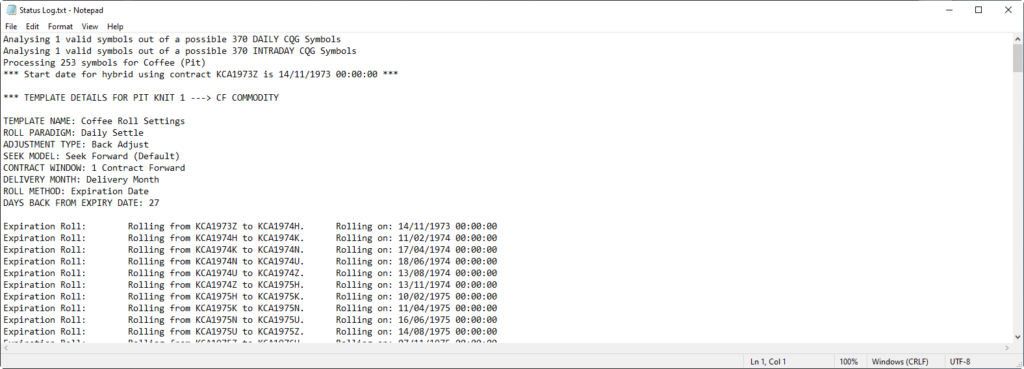
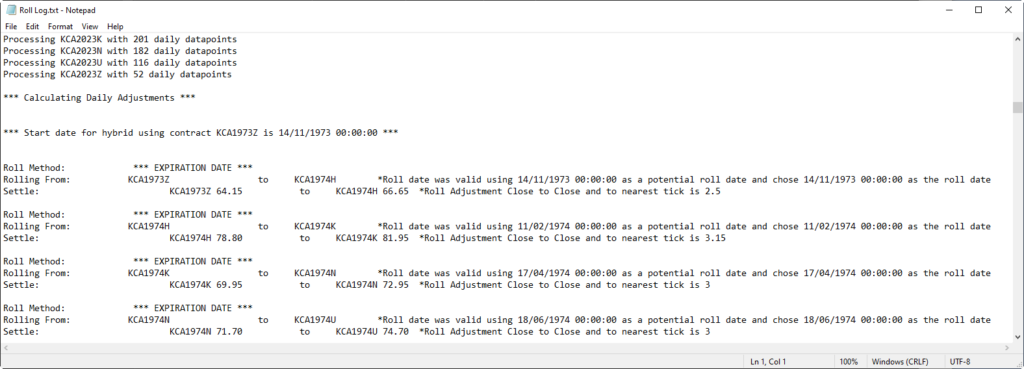
Below is an example of a data audit trail of daily and continuous futures data that has been run for Coffee from 1974 to now. Click the images to study the Roll Audit Log and the Status Audit Log. In summary you will see:
- An appraisal of what contracts and delivery months were chosen.
- In this case a calculation of the DAILY settlement adjustments to apply to the intraday 1 minute data streams.
- Potential v actual roll dates when there are holidays.
- The spread and cumulative spread values showing any contract backwardation and contango values (good trading edges to be found in here).
- Calendar date roll summaries.
- Roll model and methods used.
- Contract Window: Usually for STIR and other advanced roll methods where the liquidity can be much further forward than the nearest future.
Problem 4 | Solution 4 – Do not roll in illiquid areas
A common mistake when creating 1 minute continuous futures data is the potential of creating rolls in illiquid areas. If you do not understand the nuances of the particular commodity it is easy to purchase continuous futures data containing this fundamental mistake. All commodities behave differently. There is no magic wand or rule to follow with the creation of continuous data. For example, with Coffee, notice the 27 days prior to expiry rule in the Roll Log. The reason that value was chosen is because by trading convention the liquidity in coffee contracts traded on NYI exchange falls off way before the expiry date as published by the exchange.
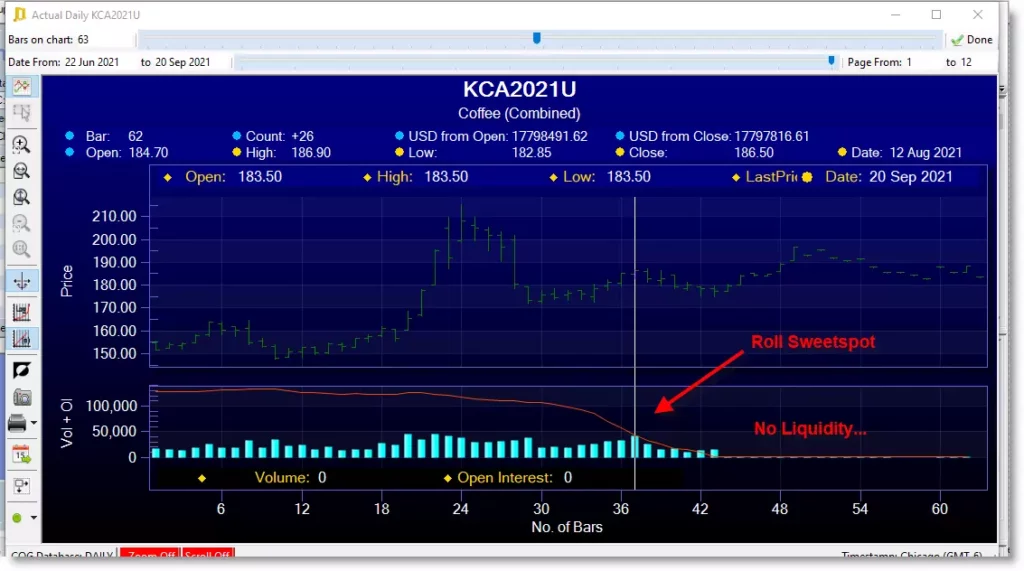
In the image above, looking at September 2021 Coffee, we can see one potential roll sweetspot at 26 days prior to the contract’s expiry. (27 days prior being just as good). What is important to notice however, is the falloff in liquidity after this time. Notice in the last 3 weeks where the contract was still open; it offered little in the way of liquidity except ‘traps’ for the unwary trader. If your continuous data isn’t created without taking this into account, you may find what appear at first site to be valid rolls are in fact absolutely not. Make sure you insist on a data audit trail of historical roll behaviour from your data supplier every time!
Problem 5 | Solution 5 – Thin markets and poor data suppliers AVOID!
In futures markets in general, liquidity needs to ‘build’ during the early stages of a contract’s life for the contract to be a good candidate for rolling. Sometimes however, the commodity may just remain thin. Apart from Problem 2 above, If you try to create a roll with intraday data or tick data that is thin it can lead to absurd choices for where to calculate the adjustment value. There may be huge gaps spanning days that make the whole stream a mess.
Intraday or tick data which fails to include the settle price may produce continuous data that is wildly different to anything deemed as sesible. This is because there is no ‘central mechanism’ at play in which to match back with. What can initially appear to be valid data at first can result in consternation further on down the line. If there are no trades or there are little amounts of trades present or there are vast swathes of patchy data the watch out. If the data looks absurd then this will potentially be the reason. You need a supplier who handles these type of scenarios as standard.
Problem 6 | Solution 6 – Purchase data from veteran suppliers with LONG data reaches
Why do you think that only one or perhaps two companies in the world provide long-reach intraday and tick data prior to 2007/2010?
The reason is deep historical futures data is not like data today. Many of the futures markets that traded back then that still trade today were originally fractional based and not decimal. For instance, Soybeans trades in 0.25 increments today. That was known as quarters in the past i.e. ¼s. In the 1960’s and very early 1970s it even traded in 1/8s.
The cost of hard drive space in the 1980’s was very expensive. Hard drives of that era were only available in capacities of a few megabytes! For the few data collection services that existed then it was common to try to limit data collection by the use of a flag state. So a price of 10 and a quarter was recorded as 10.2 (dropping the 5 for space reasons). 10 and three quarters would be 10.7 etc. It was then a matter of interpolation to convert back. The fun begins when creating continuous data. 10.7 can easily become 10.8 or 10.1! What do you do then? We have seen suppliers sell data like this without even realizing its flag-based data and needs a conversion.
Problem 7 | Solution 7 – Continuous data tick size issues over time
Tick sizes throughout history often change. And little known to most are that tick sizes between the most active contract and less active contracts under certain conditions differ. This is true today not just historically. You need continuous data whereby the complete stream is homogenous to the tick size through the ENTIRE history not just sections of it. If you don’t you will be backtesting on tick sizes that don’t exist. Roll algorithms and data import tools in backtesters are unforgiving as far as situations like this are concerned. Don’t find out the hard way!
Problem 8 | Solution 8 – Use a data provider that can tailor the service to you personally
My data won’t import into my backtester or code! This is a common scenario we encounter when people tell us the have purchased cheap data. You need data that is guaranteed to parse into any backtester under all circumstances. There are many reasons why parsing can fail. Problem 7 above is a great example however, the other problems discussed in this guide are just as relevant. Outlined below are some of the more common ones I have seen; the list is not exhaustive:
- Data is non-contiguous, i.e. future timestamps behind past timestamps.
- Double timestamps reported for the same increment of data4
- Data decimalisation inconsistent.
- Delimiters incorrect, this can be via delimiter alignment, too many of them, not the correct type etc…
- Nulls, int and double max and mins and divide by zero issues painted all over the data sets.
- There are many others but you get the idea!
Summary
As you can see, there are many moving parts in knowing how to create continuous futures data streams robustly. If you once believed it’s just a matter of purchasing ‘ready-made’ continuous intraday futures data from cheap providers at the lowest price, then you got lucky by reading this first! Quality data from a reputable supplier is the most important decision prior to entry and exit rule considerations.
Arthur Maddock was a trader at Galt Capital and traded his own fund in the UK up to 2008. He has been the CEO of Portara using CQG’s superior data sets since 2008. You may reach out to him for discussions at any time.
1Disregarding all open contracts to keep the example simple
2Once in 1974 we even have data where it traded a November contract!
3With tick, the continuous single file containing all the data may need to be split into smaller files due to OS constraints
4Not applicable with tick data