Portara | ASCII Output & Charts
Overview

Chart your Compressed data no matter what format you have chosen. Behind the scenes, Portara allows you to run analysis across millions of bars in a lightning fast page scroller, just drag-and-drop to see all the data points across 40 years of 1 minute bar.
ASCII, CSV TXT is saved to a local file structure in a logical order.
Find out how to chart your Ascii data and more below:
Chart Your Ascii Data
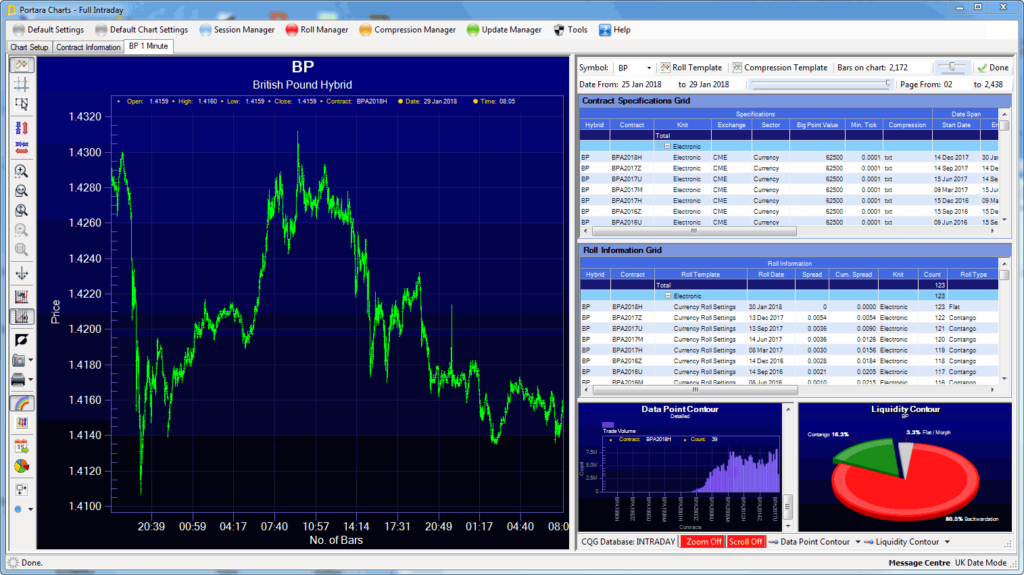
In any Outputted Format Portara Charts has been designed to interact optimally with a double monitor setup, but a double monitor is not necessary. This is…
Highlight Rolls
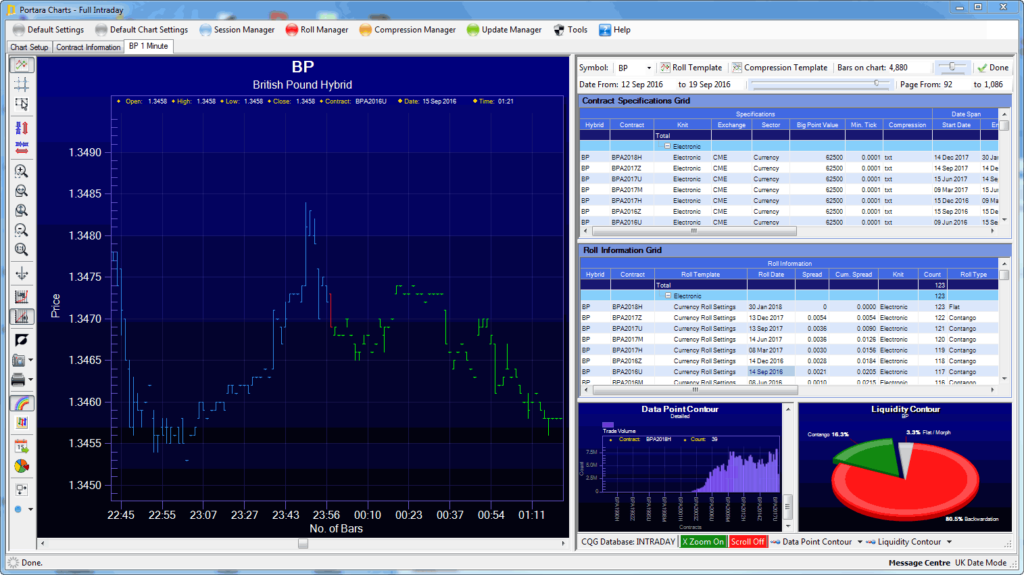
Here we have highlighted the underlying contracts making up the compressed stream so you can clearly see where the contracts have been rolled together. Notice the…
Data Analysis
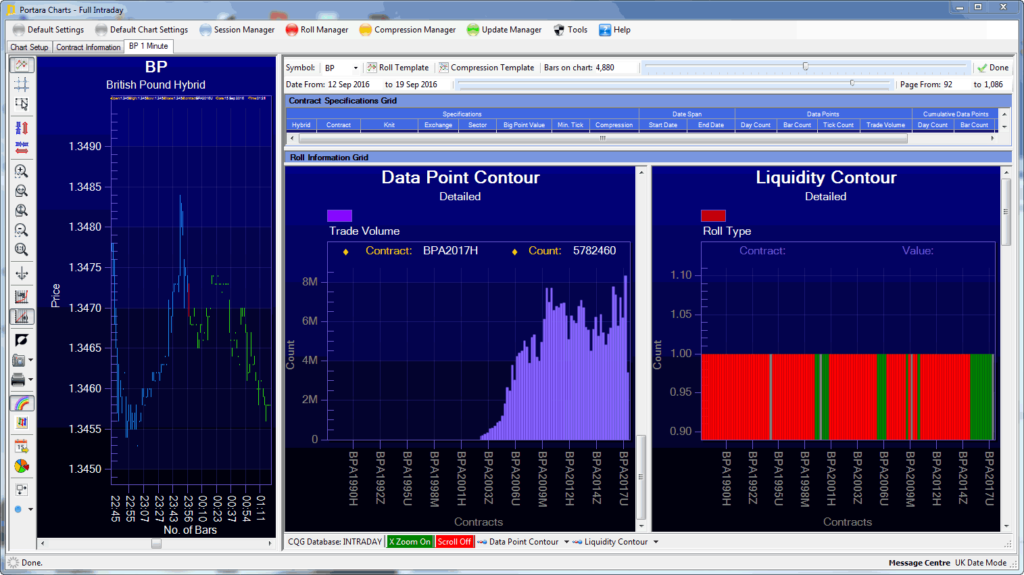
The Data Analysis Section provides the user with the attributes that determined the roll logic ascribed to the hybrid. There are two grids providing…
ASCII Data Example
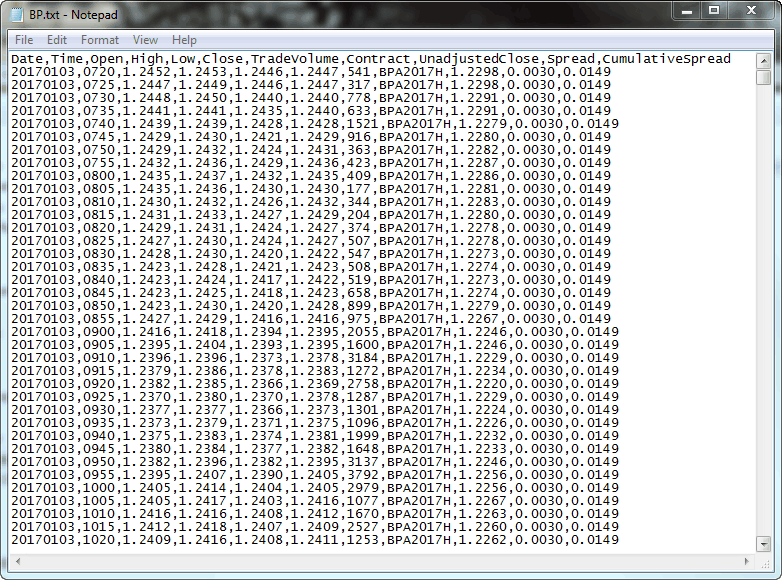
This 24hr All Sessions British Pound example was run on 5 minute bar. You can see we included Unadjusted Close, Spread and Cumulative Spread as extra columns in the run. We set the start…